Proof in the Snowpack: How to Plan Your Next Ski Trip Using SnoCountry’s Archives
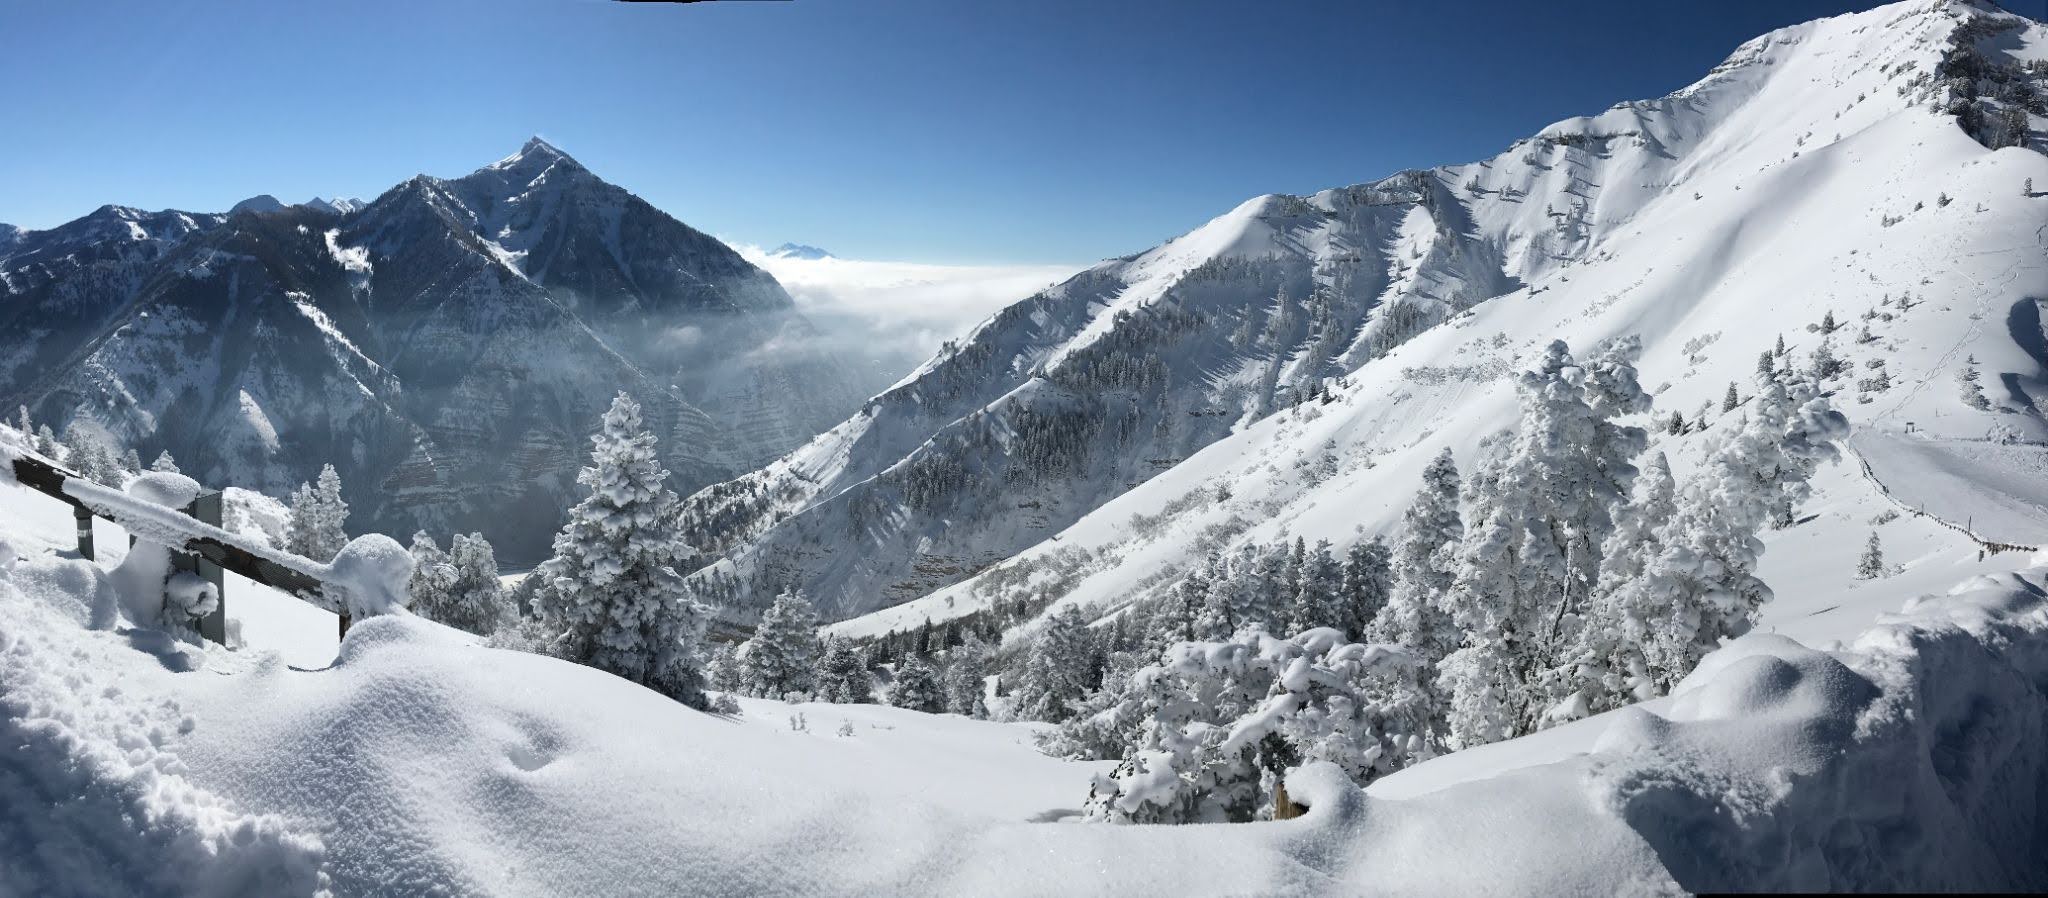
Image courtesy of Nicole Erickson
Booking a ski vacation months in advance used to feel like a high-stakes gamble. You’d pick dates on the calendar, lock in non-refundable lodging, keep your fingers crossed, and hope a storm cycle happened to align with your time off.
Today, data-minded skiers and riders don't have to rely on blind luck. By pairing macro climate indicators like SnoCountry’s El Niño Signal Map with the historical archives and the interactive SnoCountry Chat AI tool, you can research past seasonal trends, verify terrain expansion speeds, and book travel dates with total confidence.
Step 1: The Macro Picture — Fact-Checking Forecasts with the El Niño Tool
Broad oceanic weather announcements—like a strong El Niño building across the Pacific—often dominate fall weather headlines. But sensational headlines rarely explain how much snow will actually fall on your favorite ski resort.
Fact-checking those regional headlines starts with SnoCountry’s interactive El Niño Tool, which compares historical sea-surface patterns against actual resort snowfall data.
Understanding the Historical Signal Lean
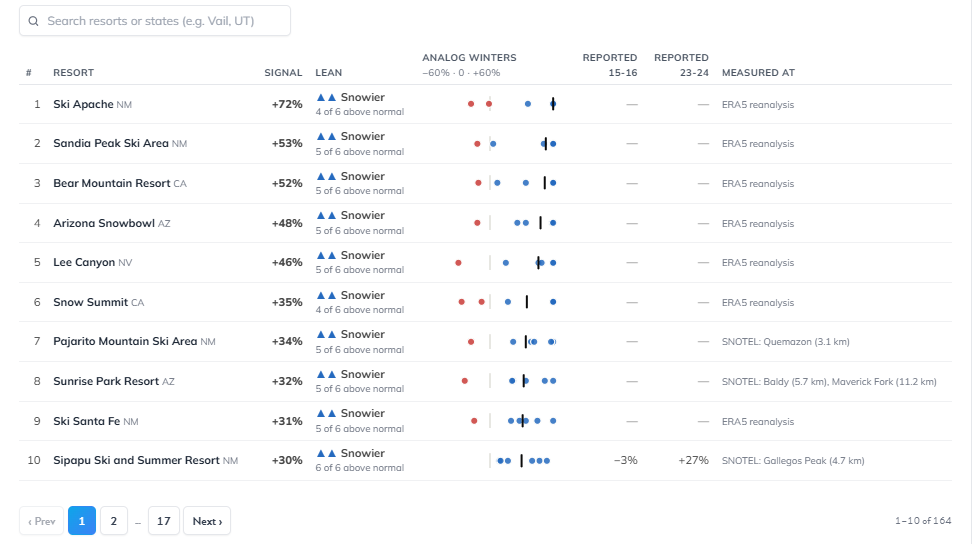
The tool analyzes mountain snow gauge data (NRCS SNOTEL) and ERA5 reanalysis across 164 Western resorts during the six strong El Niño winters since 1980 (1982-83, 1991-92, 1997-98, 2009-10, 2015-16, and 2023-24).
Think of it as historical odds, not a guarantee. It compares past strong El Niño winters directly to each resort’s 30-year normal (1991–2020) to show where precipitation historically "leans."
Strong El Niños typically split the West north-to-south:
Southern California, the Southwest (New Mexico/Arizona), and southern Colorado historically lean wetter than normal.
The Pacific Northwest, British Columbia, Montana, and the northern Rockies lean drier on average.
The Sierra Nevada and central Rockies sit on the transition line, swinging year-over-year depending on atmospheric river tracks.
Step 2: Data Analysis — Finding Your Snowpack Window with the Base Depth Archive
Once the macro El Niño map gives you a directional lean, navigate to an individual resort’s snow report page to inspect mountain-level realities.
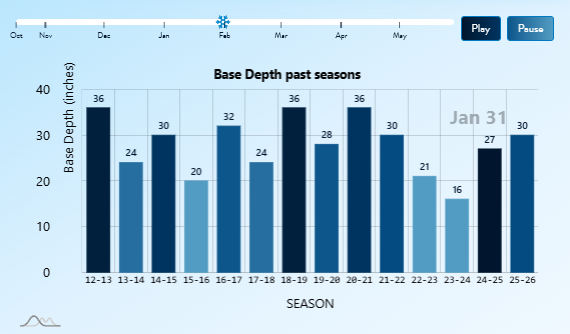
SnoCountry's Base Depth Archive removes the guesswork by tracking snowpack over time across past seasons.
How to Read the Snowpack Curve
Look for steep base-growth curves to identify resorts with high-volume snowmaking systems or cold early-season microclimates that lock in coverage early.
Evaluate late-season base longevity to pinpoint high-elevation destinations that hold a deep, rideable base well into spring.
Step 3: Evaluating Open Terrain & Trip Odds with SnoCountry Chat
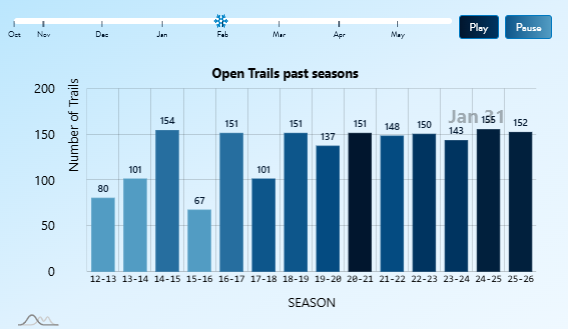
A deep base doesn't automatically mean the entire mountain is open for business. To verify when a resort transitions from core groomer corridors to 100% full-mountain capacity, check the Open Trail Archive or fire up the interactive SnoCountry Chat.
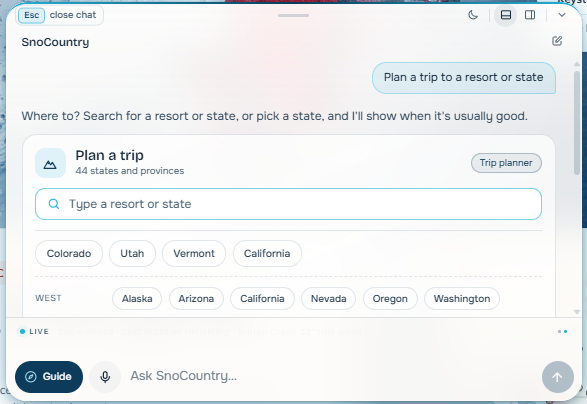
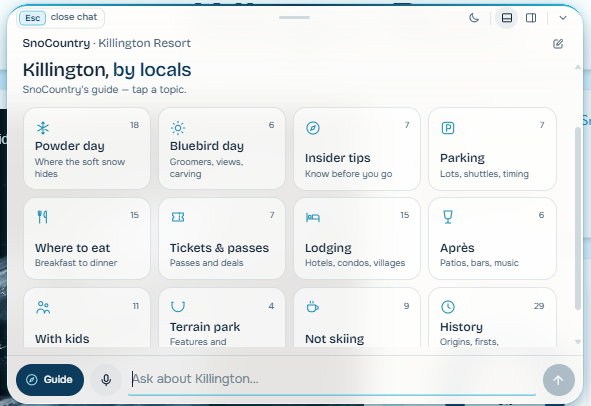
SnoCountry’s chat assistant translates up to 14 seasons of daily snow reports into direct answers about opening odds, terrain history, and logistics across ~450 resorts in 44 states and provinces.
Ways to Plan with SnoCountry Chat
Tap the tile to compare an entire state at a glance. Set your target travel date to see how often every resort has been open on that exact calendar day, expected open trail counts, and typical base depths.
Type open-ended questions like "We're taking the kids to Breckenridge over Thanksgiving, what should we expect?" The AI chat provides current conditions and historical data, surfacing customized resort guide cards right alongside your answer.
Toggle the Family Trip Switch inside any resort view to immediately prioritize kid-friendly terrain picks, ski school check-ins, parking advice, and mountain dining options.
How to Benchmark Terrain Expansion
Track total open trail counts and percentages across past Decembers to see how quickly a resort expands terrain after early-season snowmaking.
Identify when a mountain historically crosses the 80%+ open terrain mark. This ensures there is enough open acreage to spread out crowds on peak holiday weekends like MLK or Presidents' Day.
Putting the Data to Work: Benchmarking the Snowpack
The Southwest El Niño Surge: Ski Santa Fe, New Mexico
When a strong El Niño pattern builds, the Southwest is the primary beneficiary.
According to SnoCountry’s El Niño tool, Ski Santa Fe historically leans +31% snowier than its 30-year normal during strong El Niño winters.
A quick look at Ski Santa Fe’s Base Depth Archive confirms that during past strong El Niño cycles (like 2015–16 or 2023–24), the resort’s base depth surged to a massive 76 inches.
Book for mid-to-late winter during El Niño years. Target mid-January through February to take full advantage of peak historical snowpack surges.
The Rocky Mountain Benchmark: Steamboat Ski Resort, Colorado
Steamboat is famous for its "Champagne Powder" and aspen glade skiing. Because tree skiing requires a deeper natural snowpack to cover logs and brush safely, timing is everything.
Steamboat’s base depth line graph consistently crosses the critical 40"+ threshold between late December and early January.
The trail archive shows that Steamboat rapidly expands operations to near 100% capacity (crossing ~150 of its 184 trails) right around early January.
Book starting early January. This is the sweet spot when tree cover becomes reliable and maximum acreage opens without early-season operational limits.
The Midwest Snowmaking Leader: Lutsen Mountains, Minnesota
Overlooking Lake Superior, Lutsen Mountains is the Midwest’s largest ski destination. In the Midwest, winter weather can swing between extreme cold snaps and brief thaws, making snowmaking resiliency paramount.
Lutsen’s chart shows that by capitalizing on cold early-season nighttime windows, its base depth line routinely reaches 36 inches by late December.
Despite fluctuating regional air temperatures, Lutsen’s trail open percentage remains remarkably steady through mid-winter, consistently holding 50 to 60 open trails (out of 93 total) across its peaks.
Book for late December through mid-winter. Cold early-season snowmaking windows guarantee stable trail counts, making it a safe bet for holiday and winter getaways.
The East Coast Powerhouse: Killington Resort, Vermont
As the largest resort in the East, Killington serves as the ultimate benchmark for snowmaking horsepower and terrain expansion. Rather than relying solely on natural storms, Killington’s operation is built to engineer its own snowpack.
Examining the Open Trail Archive reveals Killington’s rapid terrain expansion speed: the resort typically expands from 55–60 open trails in mid-December up to 145 open trails by MLK Weekend.
Killington aggressively builds a base that peaks between 24" at the base and 38" on the upper mountain during peak winter, holding a resilient 18" base late into April and May for its spring-skiing season on Superstar.
Book MLK Weekend for full-mountain terrain, or April/May for guaranteed spring skiing. Killington offers two distinct windows: mid-January for peak operational scale, or late spring for deep base retention.
Applying the Data to Your Trip Planning
Check the SnoCountry Chat "Trip Date" tab or the Open Trail Archive to select a resort like Steamboat or Killington that historically reaches 80%+ open terrain by early January.
Use the El Niño Signal Map to identify resorts with strong "+30% wetter" historical leans (like Ski Santa Fe), then cross-reference their resort page to verify past 70"+ base depth surges.
Open SnoCountry Chat, pick your destination state, and flip on the Family Trip Switch to benchmark opening odds, expected terrain counts, and family-friendly lodging or lesson tips before locking in holiday dates.
Use the Base Depth Archive to target high-elevation mountains like Killington that maintain an 18"+ base well into late April and May.
Ready to Plan Your Trip?
Stop guessing what the weather will do. Start researching destination options with SnoCountry, test your travel dates using SnoCountry Chat, and explore the El Niño Tool to book your next ski vacation with total peace of mind.